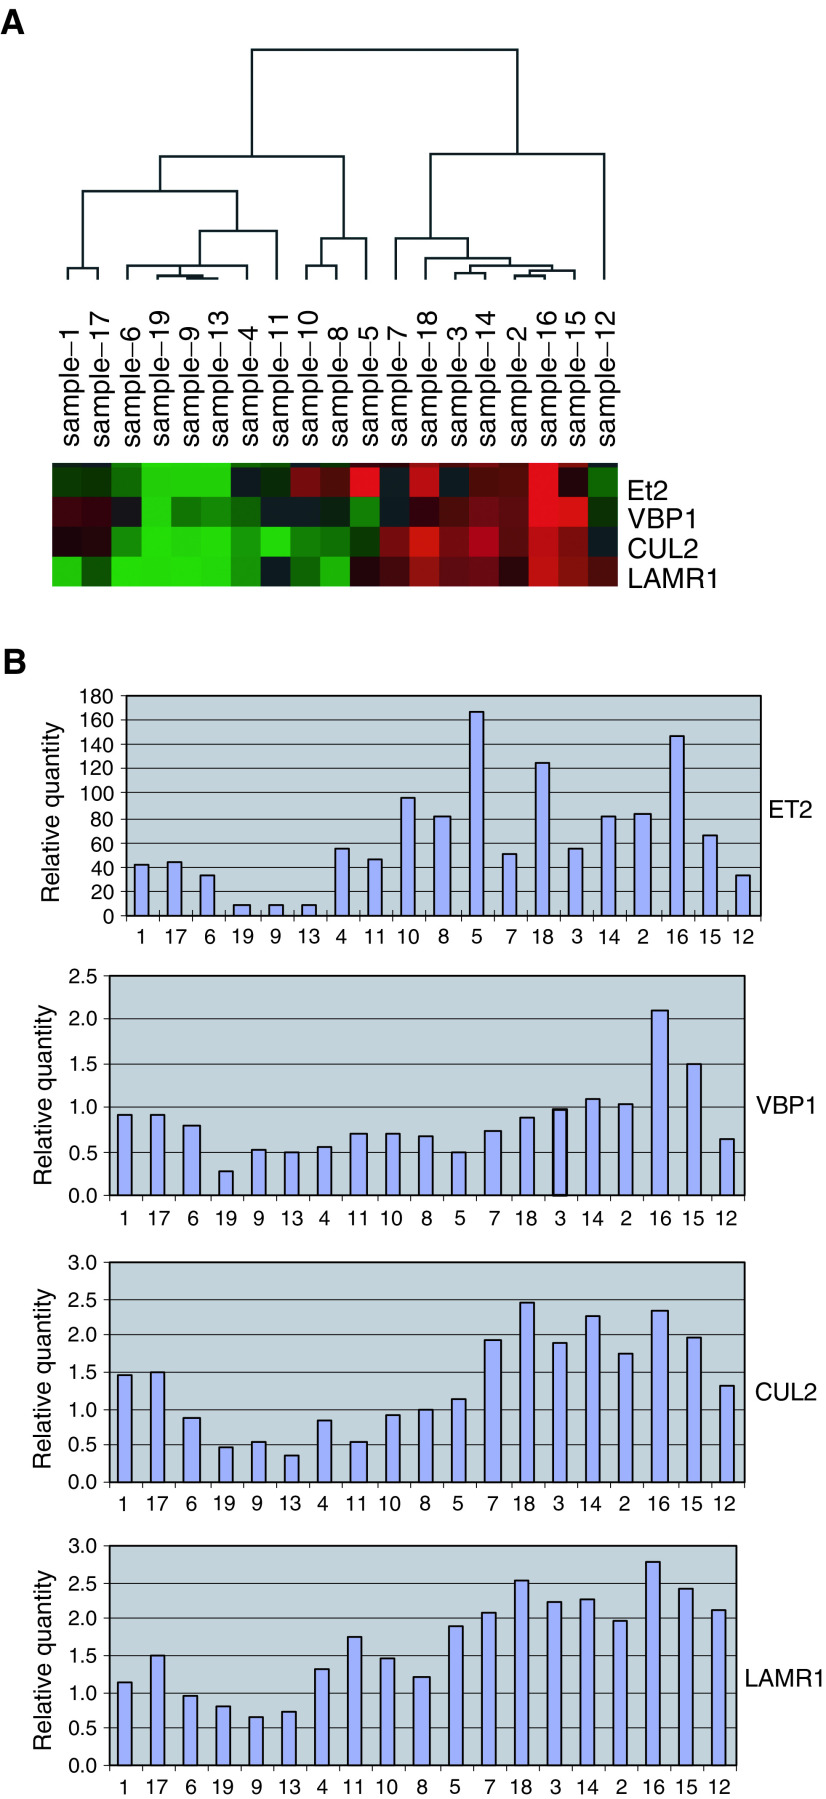
Figure 1.
(A) Cluster figure (Treeview) of the real-time RT–PCR results of fresh frozen uveal melanoma samples. Red indicates a relatively high expression level and green indicates a relative low expression level. (B) Column graphs presenting the relatively quantity of expression per gene. The samples are set in the same order as in the cluster figure. The differences in the relative expression levels between the two clusters of the uveal melanoma samples are demonstrated in these graphs as well.

