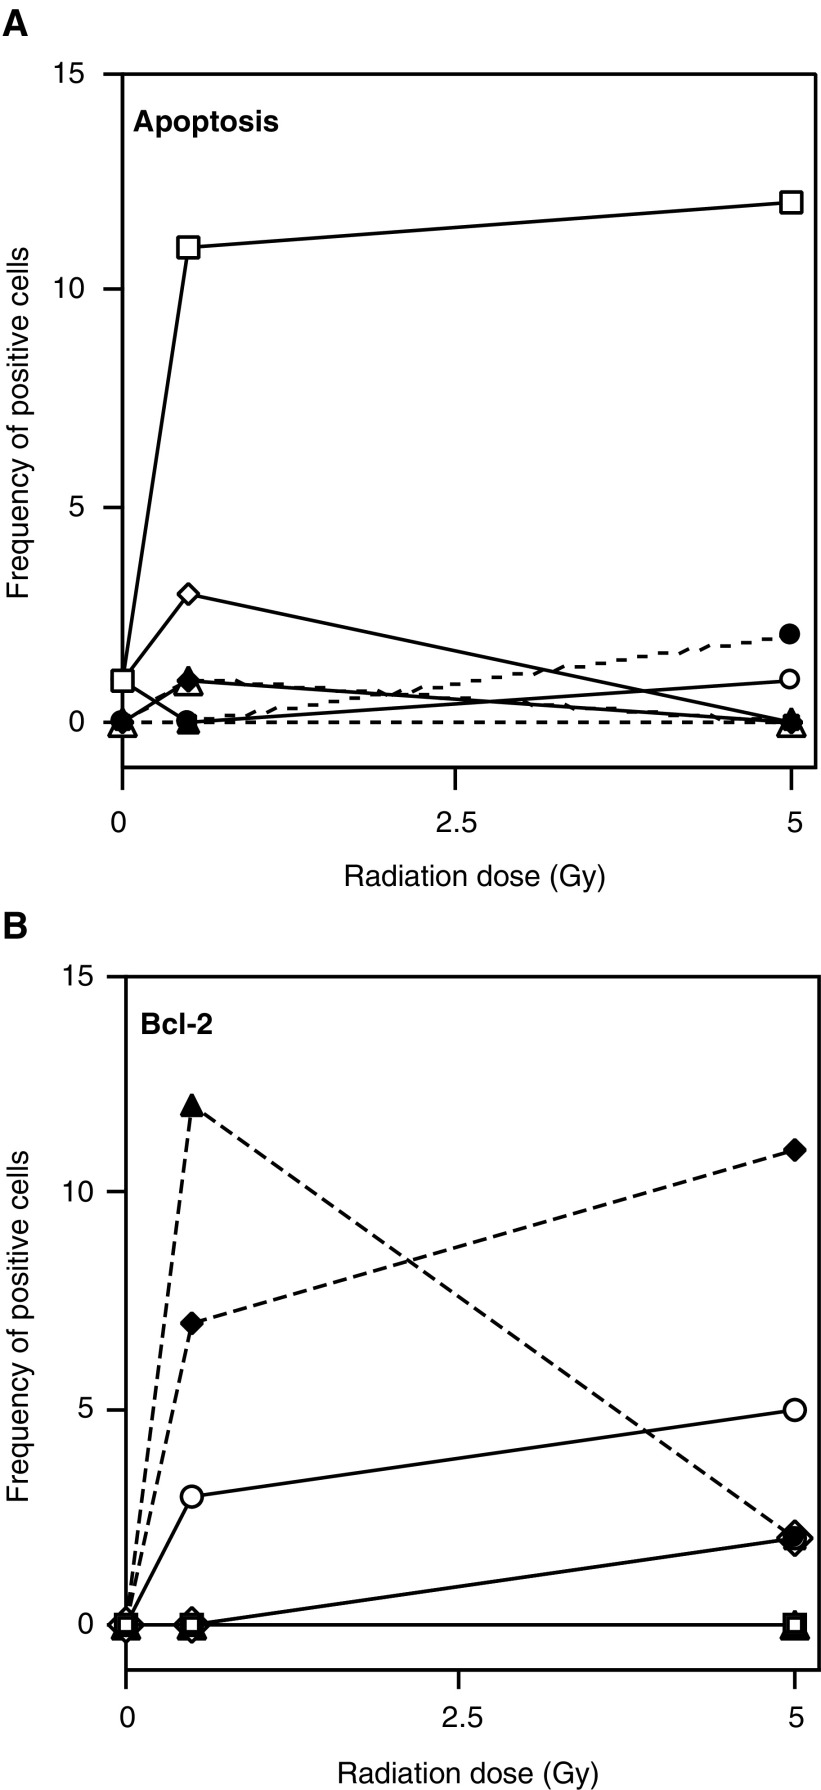
Figure 5.
Expression of apoptosis (A) and bcl-2 (B) in HaCaT cells with and without l-deprenyl treatment prior to irradiation. Cultures were all seeded with 400 cells and were fixed at 48 h postirradiation to 0, 0.5 or 5 Gy Co-60 gamma rays. Apoptosis and Bcl-2 expression were scored in the same microcolonies. In all, 20 microcolonies were scored for each culture. Five replicate cultures were counted. Data were pooled due to low frequency of the end points. The figures show the relative frequency of apoptotic and Bcl-2-positive cells in the microcolonies. Open symbols, solid lines: − deprenyl; Closed symbols, broken lines: + deprenyl. Cells per microcolony: 1 (□, ▪); 2 (○, •); 3 (◊, ⧫); 4 (▵, ▴).

