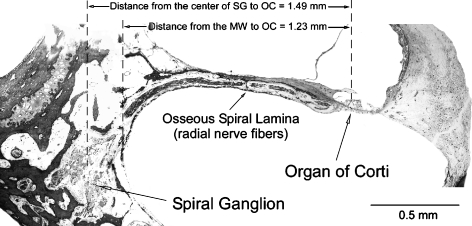
FIG. 2.
Digital image of a radial section containing both the OC and SG. This section is taken from the lower basal turn, approximately 20% from the basal end of the OC. The radial distances from the OC to the center of the SG (1.49 mm) and from the OC to the MW (1.23 mm) were measured at several points and plotted on the surface preparation images. Scale bar, 0.5 mm.

