
Fig. 5.
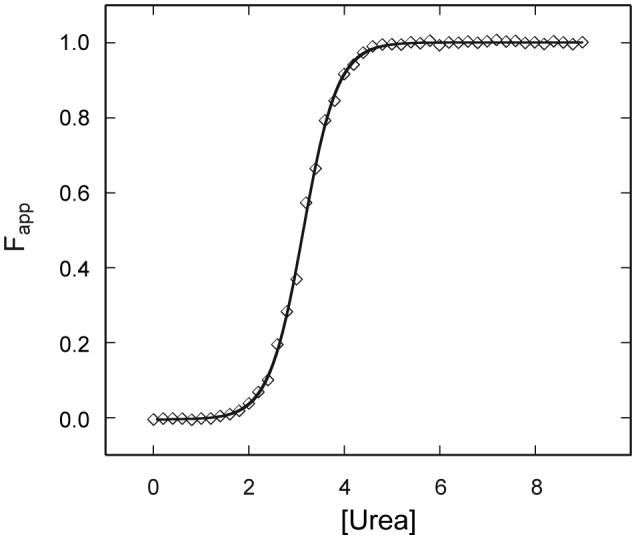
Urea denaturation of Synechococcus sp. PCC 7002 apoGlbN. The apparent fraction folded is shown at pH 7.4 in 20 mM phosphate. The protein concentration was ∼7 μM from a calculated extinction coefficient. The two-state fit is shown by the solid line, and one representative set of data is shown by the symbols.