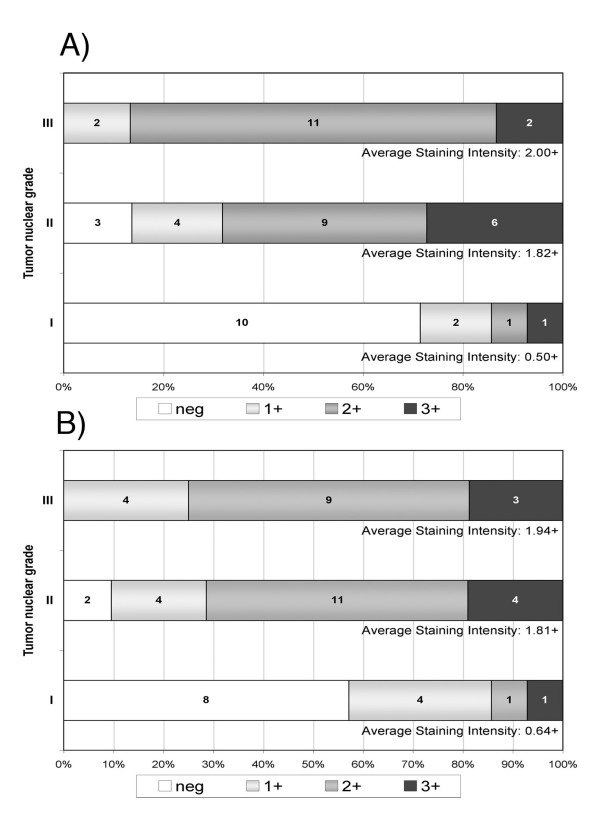
Figure 2.
Distribution of lectin staining intensity among DCIS specimens with low (grade I), intermediate (grade II) and high (grade III) nuclear grade. Vertical axes show DCIS grade. Numbers inside stacked bars show number of patients with each level of staining intensity while the horizontal axes show the patient numbers as proportions of total patients per grade. For each grade, the average staining-intensity score was calculated as: 0 × (proportion neg) + 1 × (proportion 1+) + 2 × (proportion 2+) + 3 × (proportion 3+). A) shows that average staining intensity for Griffonia simplicifolia lectin-I (GS-I) was significantly higher in grades II and III than in grade I (Mean-score chi-square = 17.60, DF = 2; P = 0.0002). B) shows that average staining intensity for Vicia vilosa agglutinin (VVA) was significantly higher in grades II and III than in grade I (Mean-score chi-square = 15.72, DF = 2; P = 0.0004).

