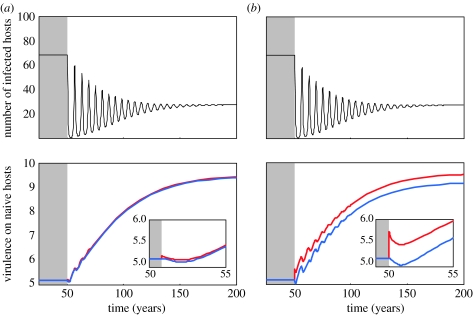
Figure 5.
Quantitative evolution after the start of vaccination with a coverage p=0.75 at t=50. In (a) and (b), we show epidemiological dynamics (number of infected hosts). In (c) and (d), we show both long- and short-term evolutionary dynamics (insert graphs show evolution 5 years after the start of vaccination) of virulence (when measured in naive hosts) of parasites infecting naive (blue) and vaccinated hosts (red). In (a) the genetic variance in virulence is 2, and in (b) the genetic variance is 20. Parameter values (see also appendix A for the notations and the functional relationships between virulence and transmission in the different types of hosts): ν1=0.9 and ν2=0.9. Other parameter values are as in figure 2b.

