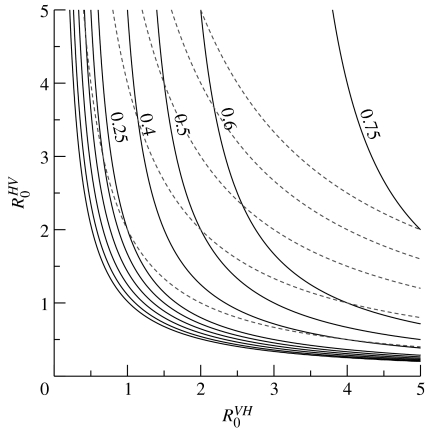
Figure 1.
Invasion probabilities in the Ross model. The solid curves are contours in the plane along which the probability of a major outbreak, following the introduction of a single infective vector, is constant. From left to right, the contours are shown for invasion probabilities of 0.01, 0.05, 0.1, 0.15, 0.2, 0.25, 0.4, 0.5, 0.6 and 0.75. Where space permits, these probabilities are indicated to the right of the contours. The dashed curves denote contours along which the overall R0 (i.e. the product ) is constant. From left to right, these curves depict R0 values of 2, 4, 6, 8 and 10. As discussed in the text, the corresponding figure for the probabilities following the introduction of a single infective host can be obtained by switching the labels of the two axes.

