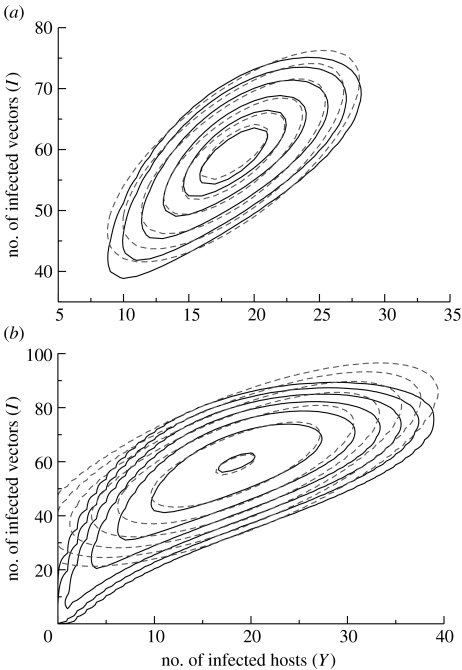
Figure 3.
Quasi-stationary distribution of the numbers of infective hosts and infective vectors. The solid curves are contours of the probability density function calculated directly from the Kolmogorov equations. Dashed curves denote the corresponding contours calculated using the multivariate normal approximation. As discussed in the text, these contours are ellipses. (a) Contour heights are such that the ellipses of the multivariate normal distribution enclose 20, 40, 50, 80, 90 and 95% of the mass of the distribution. (b) Contour heights employed by Nåsell (1991) are used; his choice of contours emphasizes the tail of the distribution. Note that the scales on the axes differ between (a) and (b). The same set of parameter values is used for both (a) and (b) and is the set employed by Nåsell (1991), with α=0.05, β=4, ξ=0.1, δ=1, H=50 and V=100.

