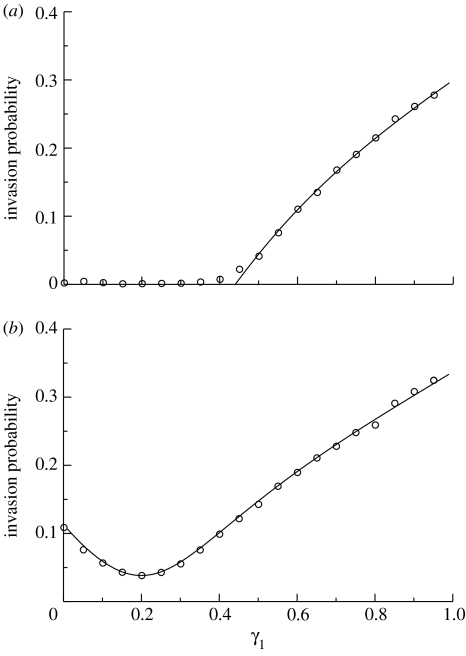
Figure 5.
Major outbreak probability, following the introduction of infection with a single infective vector, in a two-host, one-vector model, as a function of the vector's preference for the first type of host. A fraction γ1 of bites are made on hosts of type 1 and γ2=1−γ1 are made on hosts of type 2. The solid curve denotes the invasion probability found by solving equation (4.13) and calculating 1−sV, and the symbols depict probabilities estimated from numerical simulation, using 10 000 realizations for each set of parameter values. Parameter values are as follows: p=0.2; q=0.15; k=0.5; ξ=δ=1/7; H1=200; and H2=800. (a) V=2000, and (b) V=3000.

