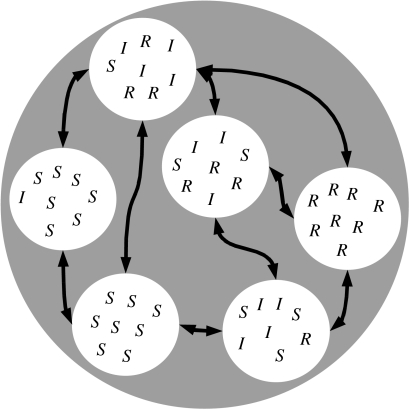
Figure 1.
Structure of the population. The grey circle represents the whole population, white circles represent patches, arrows represent migration of individuals between patches. S, I and R stand for susceptible, infected and removed, respectively. The bottom-left patch is still disease-free, while the patch on the left has just been colonized. The parasite is locally extinct in the patch on the right.

