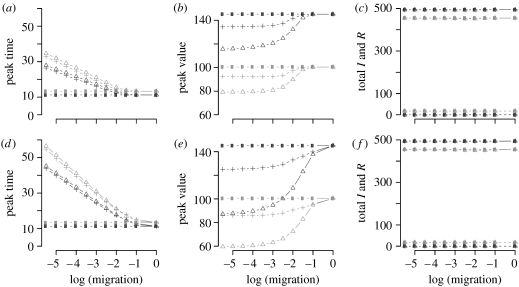
Figure 4.
Impact of population structure and of public health interventions on the dynamics and final outcome of the epidemic. Structures: island (a–c), spider (d–f); interventions: no drugs (dark grey), treatment (grey); number of subpopulations: 1 (circle), 5 (triangle) and 15 (cross). The total size of the populations is N=500. (a) Time of the epidemic's peak as a function of migration, in days. (b) Value of this peak. (c) The total number of infected and resistant cases. Note that the results of the prophylaxis intervention are not shown here because they depend strongly on the number of subpopulations and the migration coefficient.

