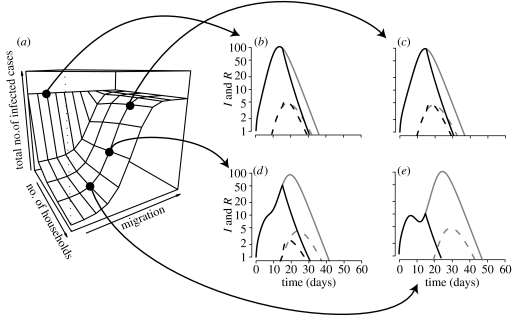
Figure 5.
(a) The total number of infected cases as a function of the structure of the population. (b–e) Time course for selected points. The population is island-shaped, its total size being N=500 individuals, and prophylaxis starts on day 15. (b) A homogeneous population. (c–e) Fifteen subpopulations. The migration coefficient is 10−2, 10−3 and 10−4 in (c), (d) and (e), respectively. (b–e) The population mixes less and less homogeneously. Grey, treatment; black, prophylaxis. Solid line, infected cases; dashed line, resistant cases.

