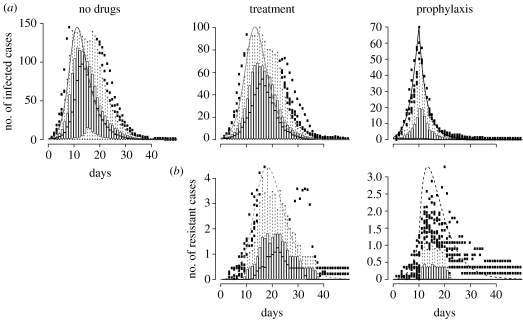
Figure 7.
A comparison between deterministic and stochastic versions of the model without population structure. We assumed only one population of 500 individuals, and that prophylaxis starts on day 10. The smooth curve is the prediction of the deterministic model, and the box and whiskers plots summarize realizations of the stochastic model (we show here only the realizations in which there was at least one secondary case among the 100 runs). (a) Infected cases over time. (b) Resistant cases over time.

