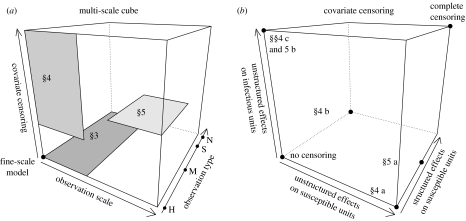
Figure 1.
(a) Cube representing the space partly explored in this paper. The fine-scale model is at the origin (units with infinitesimal areas, presence/absence for the disease measure, no covariate censoring). The grey rectangles are the zones of the cube which are explored in §§3, 4 and 5. On the observation-type axis the letters H, M, S and N denote, respectively, the following disease measures: presence/absence, count of infected subunits, severity and count of lesions (notation introduced in §3).(b) Cube representing the decomposition of the censoring axis drawn in the cube of (a). At the origin of the cube, there is no censoring; at the opposite point the censoring is complete; the other points correspond to intermediate situations tackled in this paper.

