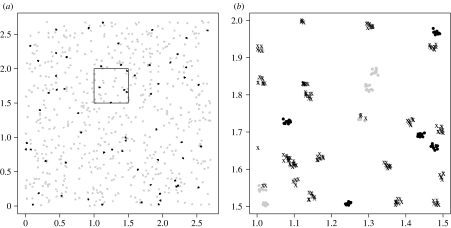
Figure 2.
Simulated data set. (a) Locations and initial health status of orchards (grey dots, susceptible orchards; black dots, infectious orchards). (b) Close-up of the zone delimited by the square on (a). The symbols are now located at tree locations and give the final health status of the trees (grey dots, susceptible trees; black dots, infectious trees; crosses, newly infected trees).

