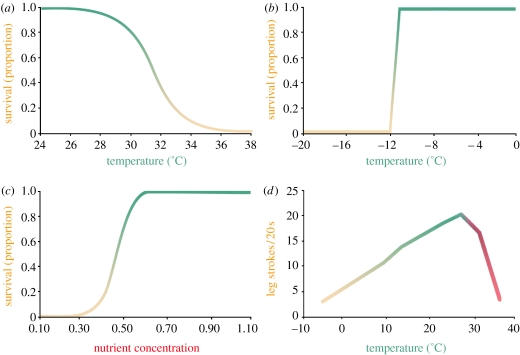
Figure 1.
The form of responses populations show to varying environmental factors. These might be (a) logistic, as in this temperature response curve; (b) threshold, as in the survival response to low temperature in a species that can tolerate freezing up to −11°C; or (c) asymptotic, as is frequently found in plants relative to a limiting nutrient. (d) Performance curve demonstrating a rate response to temperature. Note the asymmetry of the curve at the higher temperature end.

