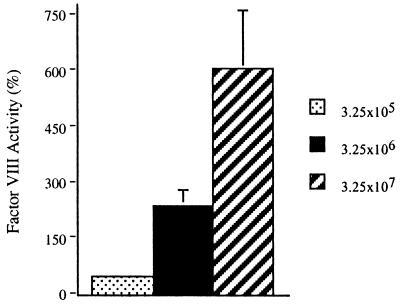
Figure 4.
Dose-response relationship between pfu of Ad-mFVIII delivered i.p. and level of FVIII activity achieved in hemophilic animals. The level of FVIII activity at day 2 of life is plotted on the y axis. Animals receiving 3.3 × 10⁵ pfu of Ad-mFVIII are represented by the stippled bar; animals injected with 3.3 × 10⁶ pfu of Ad-mFVIII are represented by the black bar; and the group injected with 3.3 × 10⁷ pfu of Ad-mFVIII is represented by the striped bar. Each group included three or more animals. The line above each bar indicates SEM.

