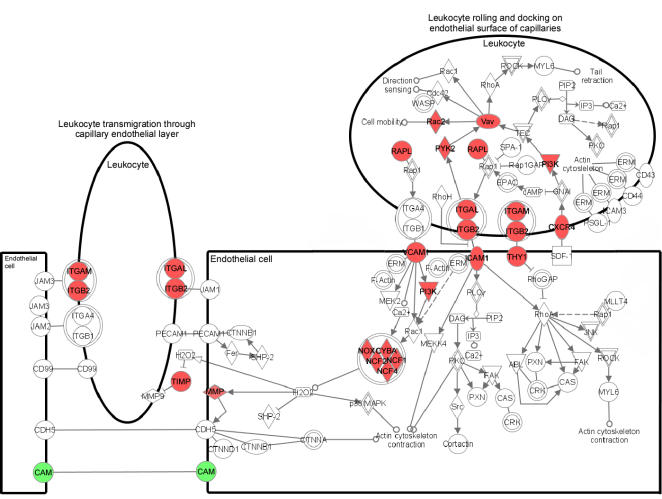
Figure 3. Pathway diagram showing the molecules involved in leukocyte extravasation signaling and their interaction.
Color nodes: genes that changed significantly in RPE/choroid from old animals with a fold change >2. Red: upregulation; green: downregulation. The diagram was modified from Ingenuity Pathway Analysis (Ingenuity® Systems).

