
Figure 1. RelB levels are inversely correlated with ERα status in breast cancer cells. (a).
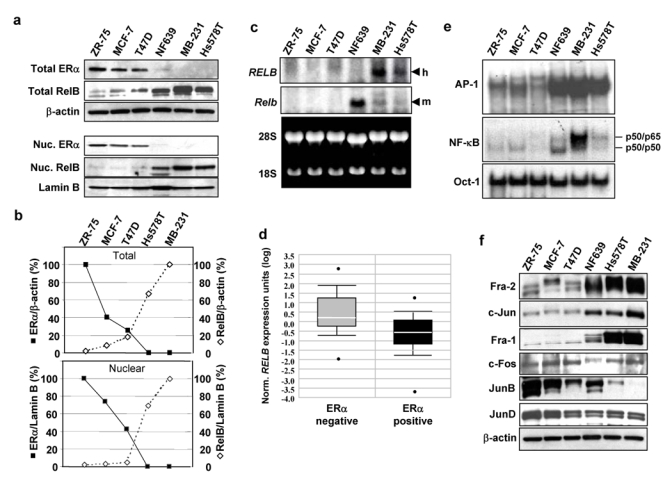
Upper panel. WCEs (25 μg) from the indicated breast cancer cells were analyzed by immunoblotting with antibodies against ERα, RelB, and β-actin, which confirmed equal loading. Lower panel. Nuclear extracts (25 μg) from the indicated breast cancer cells were analyzed by immunoblotting for ERα, RelB and Lamin B. MB-231, MDA-MB-231. (b) The blots for the human cell lines in (a) were scanned and the values for ERα and RelB normalized to β-actin (upper panel) or to Lamin B (lower panel) plotted as a percent of the values in ZR-75 and MDA-MB-231 cells, respectively (set at 100%), showing an inverse relationship between these two proteins. (c) Samples of mRNA (20 μg) were subjected to Northern blot analysis using either human RELB (h) or mouse Relb (m) cDNA, as probe, as they only weakly hybridize across species. Ethidium bromide staining confirmed equal loading. In RT-PCR analysis, RELB mRNA levels in ZR-75, MCF-7, T47D, and Hs578T cells were 3.9%, 16.0%, 19.2%, and 57.2% of those seen in MDA-MB-231 cells (not shown). (d) Box plots of data from the Van de Vijver_Breast carcinoma microarray dataset (reporter number NM_0065096) was accessed using the ONCOMINE™ Cancer Profiling Database (www.oncomine.org) and is plotted on a log scale. The dataset includes 69 ERα negative and 226 ERα positive human primary breast carcinoma samples. A Student t-test, performed directly through the Oncomine 3.0 software, showed the difference in RELB expression between the two groups was significant (p-value = 3.9 e-11). (e) Nuclear extracts (5 μg) were subjected to EMSA binding of AP-1, NF-κB, or Oct-1, which confirmed equal loading. The positions of the previously identified p50/p50 and p50/p65 NF-κB complexes in Hs578T cells9 are as indicated. (f) Nuclear extracts (25 μg) were analyzed for Fra-2, c-Jun, Fra-1, c-Fos, JunB, JunD, or β-actin. Uncropped scans of the top two panels in a and e are shown in the Supplementary Information, Fig. S5a and S5b, respectively.