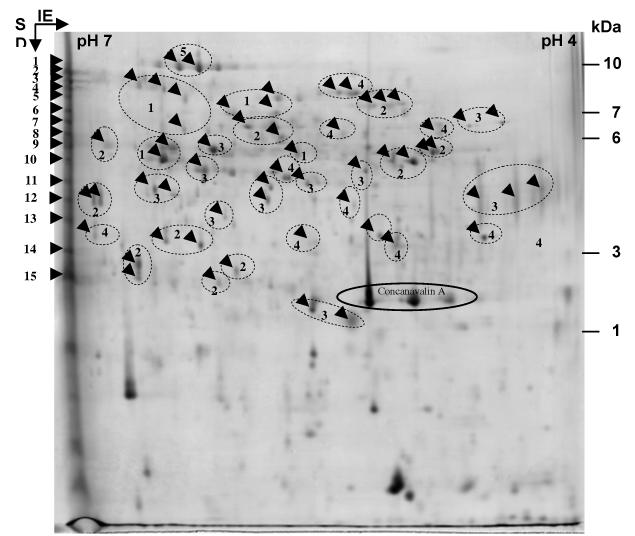
Fig 1.

Analysis of A. thaliana proteins by 2D-electrophoresis. The 2D-gel was loaded with 250 μg of the fraction obtained after Con A Sepharose affinity chromatography from stem tissues of A. thaliana. The gel was stained with colloidal Coomassie blue. Fifteen spots were picked for nanoHPLC-MS/MS (1 to 15) and fifty-seven for MALDI-TOF analyses. In the latter case, numbering refers to groups of spots containing the same protein. Arrows in the circles represent same identified proteins. Molecular mass markers are indicated on the right.
