
Figure 1.
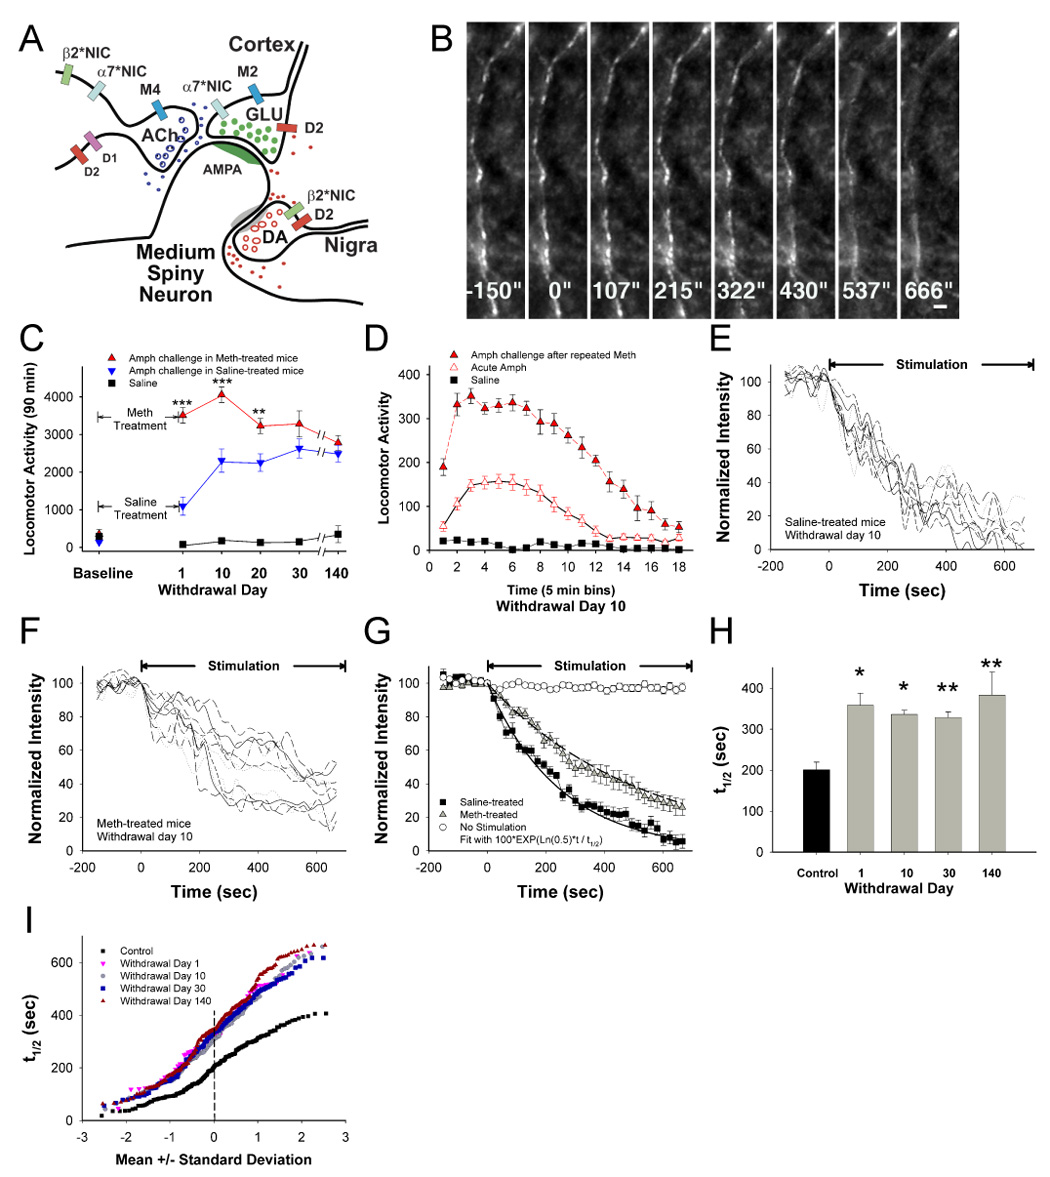
Chronic presynaptic depression (CPD). (A) In this simplified striatal microcircuit, dopaminergic (DA) nigrostriatal fibers and cholinergic (ACh) interneurons modulate excitatory glutamatergic (GLU) corticostriatal projections on medium spiny neurons. Neurotransmitter release is modified by D1 and D2 DA receptors, M2 and M4 muscarinic receptors and α7*- and β2*-nicotinic receptors. (B) Multiphoton images of corticostriatal terminals obtained from the forelimb motor striatum, located 1.0 – 1.5 mm from the site of cortical stimulation. Images captured every 21.5 seconds reveal en passant arrays of corticostriatal terminals. Restimulation at t=0 with 10 Hz pulses shows activity-dependent destaining of fluorescent puncta. Bar: 2 µm. (C) Amphetamine (AMPH; 2 mg/kg i.p.) -elicited locomotor activity measured by ambulation summed over 90 min was determined in mice following treatment with repeated saline or methamphetamine (METH) for 10 days. Repeated METH produced a 1370%–1970% increase in AMPH-elicited ambulation through 140 days of withdrawal (p<0.001, t-test with Bonferroni correction), significantly higher than saline-treated mice challenged with saline (F(5,70)=19; n=8 mice per condition; p<0.001). Repeated METH also produced a 12%–219% increase in ambulations compared to saline-treated mice also receiving AMPH challenges (F(5,70)=8.5; p<0.001, repeated measures ANOVA), although the difference between the two treatments narrowed after withdrawal day 20 (**p<0.01, ***p<0.001, ANOVA). All values are mean±SE. (D) AMPH-elicited locomotor activity 10 days following repeated METH was higher and of longer duration, when compared with responses from saline-treated mice challenged with AMPH (F(17,238)=9.1; n=8 mice per condition; p<0.001, repeated measures ANOVA). (E) Time-intensity analysis of FM1–43 destaining from individual puncta (n=8) in slices from saline-treated mice. Stimulation begins at t=0 sec. (F) FM1-43 destaining is depressed 10 days following repeated METH. (G) Mean±SE florescence intensity of puncta shown in panel E and F demonstrates preservation of 1st order release kinetics following repeated saline or METH. The plateau line represents fluorescence measurements in the absence of stimulation. (H) Repeated METH inhibits corticostriatal release halftimes (t1/2) over 140 days of withdrawal. n=4 mice per condition; *p<0.05, **p<0.01, t-test with Bonferroni correction. (I) Individual terminal responses from panel H are represented in a normal probability plot. All terminals were depressed during withdrawal.