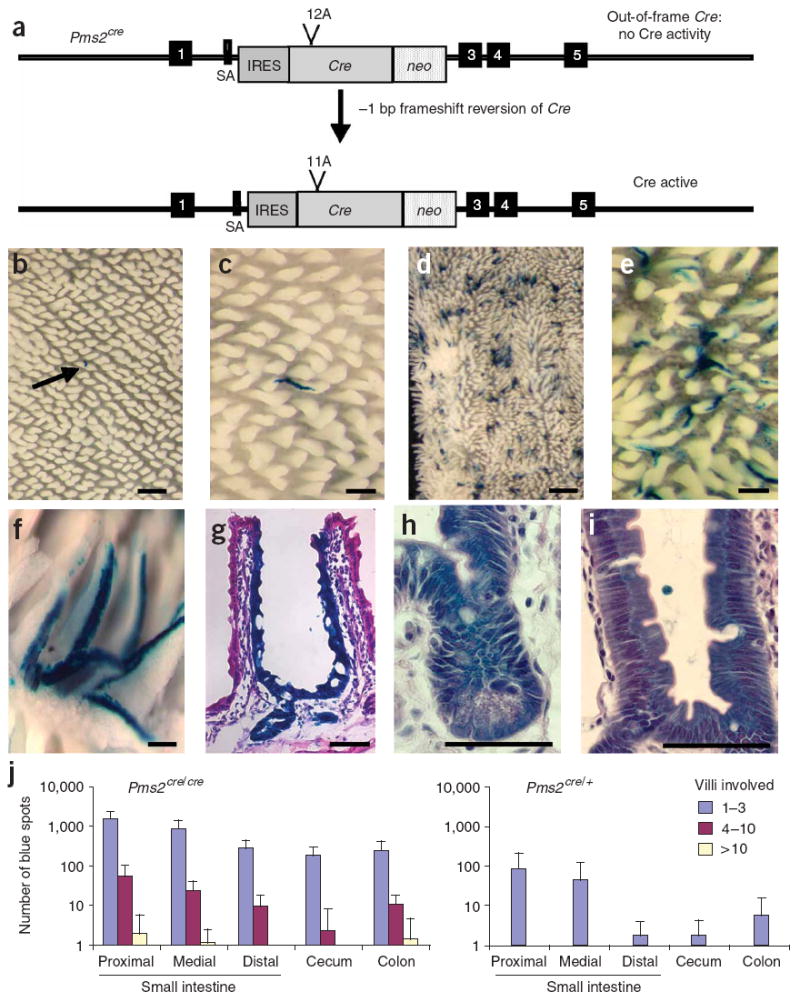
Figure 1. Generation and characterization of Pms2cre mice.

(a) A schematic of the Pms2cre allele activation by a −1-bp frameshift in the 12A run. SA, splice acceptor; IRES, internal ribosome entry site. Boxes 1 and 3–5 represent exons.
(b–f) β-galactosidase staining in whole-mount mouse intestinal sections. Different magnification images of Pms2cre/+ (b,c) and Pms2cre/cre (d–f) small intestine. Scale bars, 1 mm (d), 0.5 mm (b), 0.25 mm (c,e) and 0.1 mm (f). Arrow in b indicates the single spot in the field.
(g–i) Hematoxylin and eosin–stained 5-μm paraffin sections of Pms2cre/cre small intestine crypt. Scale bars, 50 μm (g) and 25 μm (h,i).
(j) Distribution of average number of blue spots in the gastrointestinal tract of age-matched Pms2cre/cre (n = 10) and Pms2cre/+ (n = 4) mice. Error bars, s.d.
