
Figure 2. Activation of K-ras results in larger regions of β-galactosidase staining.
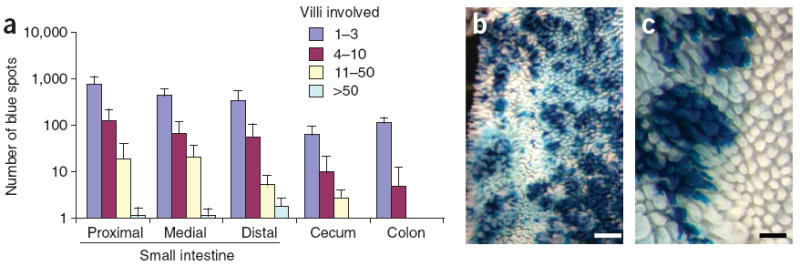
(a) Distribution of average spots per region in Pms2cre/cre, LSL-K-rasG12D mice (n = 5). Error bars, s.d. The size spot per area increases compared to Pms2cre/cre, Rosa26r mice. (b,c) β-galactosidase staining in whole-mount small intestine from Pms2cre/cre, LSL-K-rasG12D mice shows expanded (large) regions of staining. Scale bars, 1 mm (b) and 0.5 mm (c).