
FIG. 3.
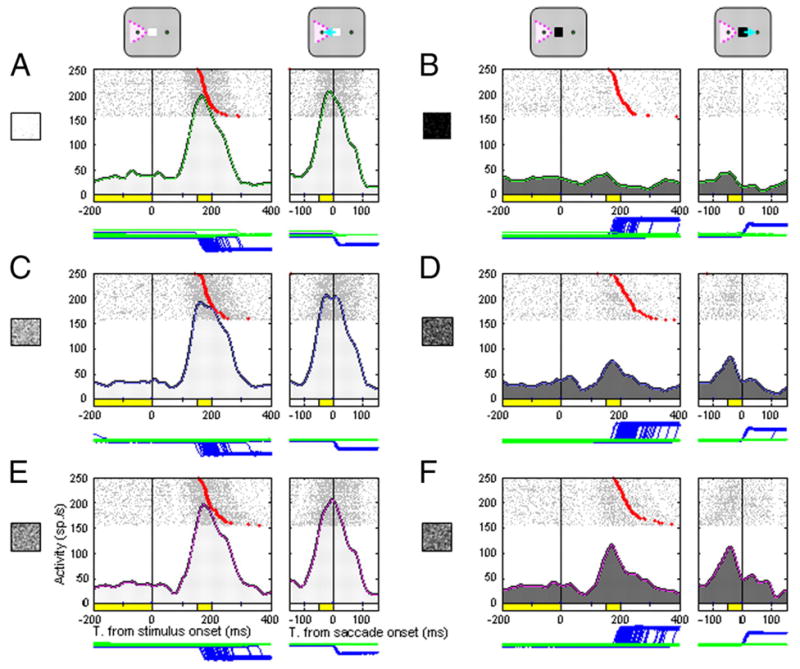
Activity of a superior colliculus (SC) neuron during the oculomotor brightness-discrimination task. Trials are synchronized to the appearance of the brightness stimulus (left, vertical line through each histogram) or the saccade onset (right). For rasters aligned to stimulus appearance, the red symbol in each trial indicates the beginning of the saccade. A, C, and E: trials where the monkey correctly identified a bright stimulus and made a leftward saccade into the neuron’s response field. B, D, and F: trials where the monkey identified a dark stimulus and made a rightward saccade away from the neuron’s response field. A and B: easy condition. C and D: middle condition. E and F: hard condition. The spike density histogram below each raster was generated by first convolving single trial neuronal activity using a Gaussian kernel with a sigma of 10 ms (Richmond et al. 1987), then averaging the spike density profile across trials. The eye position is shown as blue (horizontal) and green (vertical) traces under each histogram.