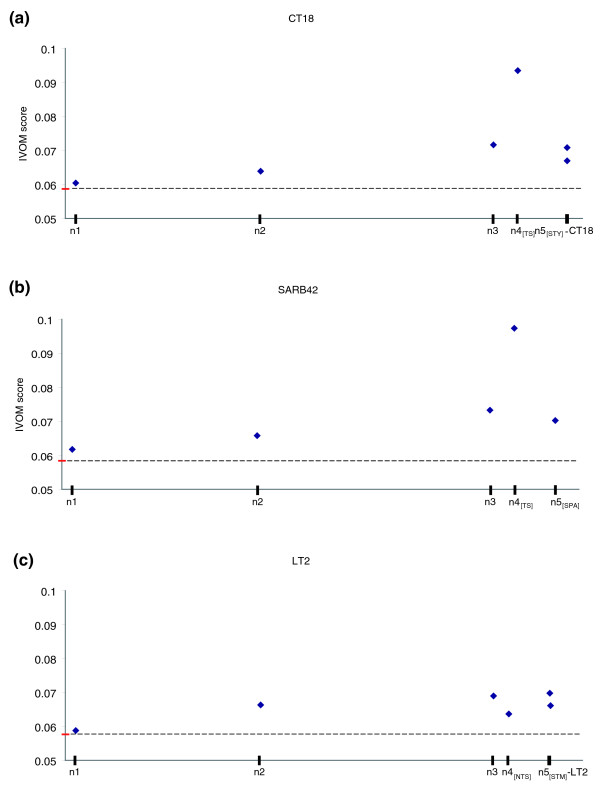
Figure 4.
IVOMs score versus relative time of insertion. Average score, taking into account higher order compositional biases, of putative horizontally acquired genes versus the inferred relative time of insertion in the three query genomes: (a) S. typhi CT18, (b) S. paratyphi A SARB42, (c) S. typhimurium LT2. The score is calculated implementing the IVOMs method. The average score for the three query genomes is highlighted in red (the dashed line is provided for ease of comparison). The nodes on the X-axis are scaled according to the respective branch lengths of the tree topology shown in the inset of Figure 2.

