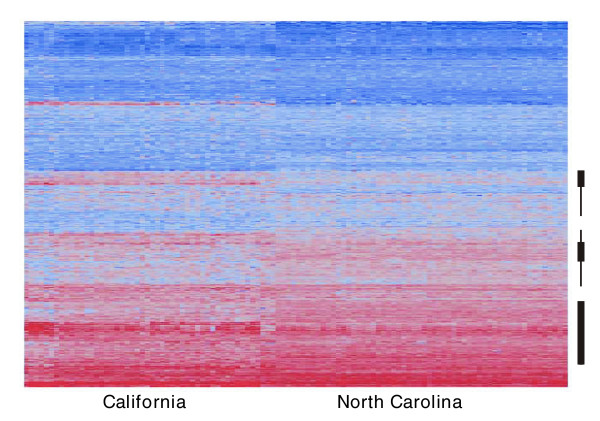
Figure 1.
Two-way hierarchical clustering of abundance of all transcripts in NC and CA samples. The heat map indicates relatively high abundance in magenta and low abundance in blue, with each row corresponding to one gene and each column one line of flies. Thick bars to the right indicate genes that appear to differentiate the NC and CA samples, whereas the thin bars highlight genes that have polymorphic expression in both samples. CA, California; NC, North Carolina.

