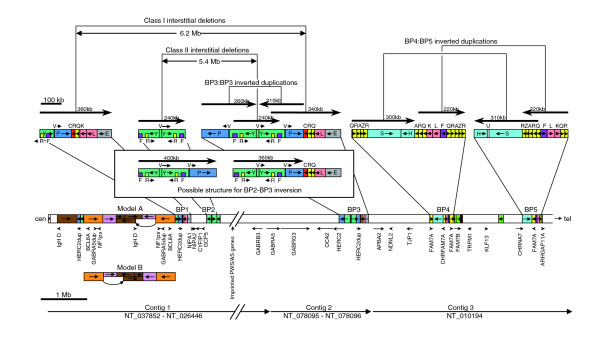
Figure 7.
Map showing positions of segmental duplications of 15q11-14 in the RP11 individual. The main part of the map shows the segmental duplications as in Figures 2, 3 and 5, with the approximate positions of genes, duplications (dup), and pseudogenes (ps) shown underneath and the positions of the three remaining contigs at the bottom. Note that most of the imprinted region in the Prader-Willi/Angelman syndrome critical region is not included. The alternative structure (model B) near the centromere is shown underneath. The duplicated regions in each of the five breakpoint regions (BP1 to BP5) are shown in more detail above the map and include the probable structure for those individuals with a BP2:BP3 inversion. The positions of the major direct and inverted repeats are shown above the detail with arrows in an arbitrary direction.

