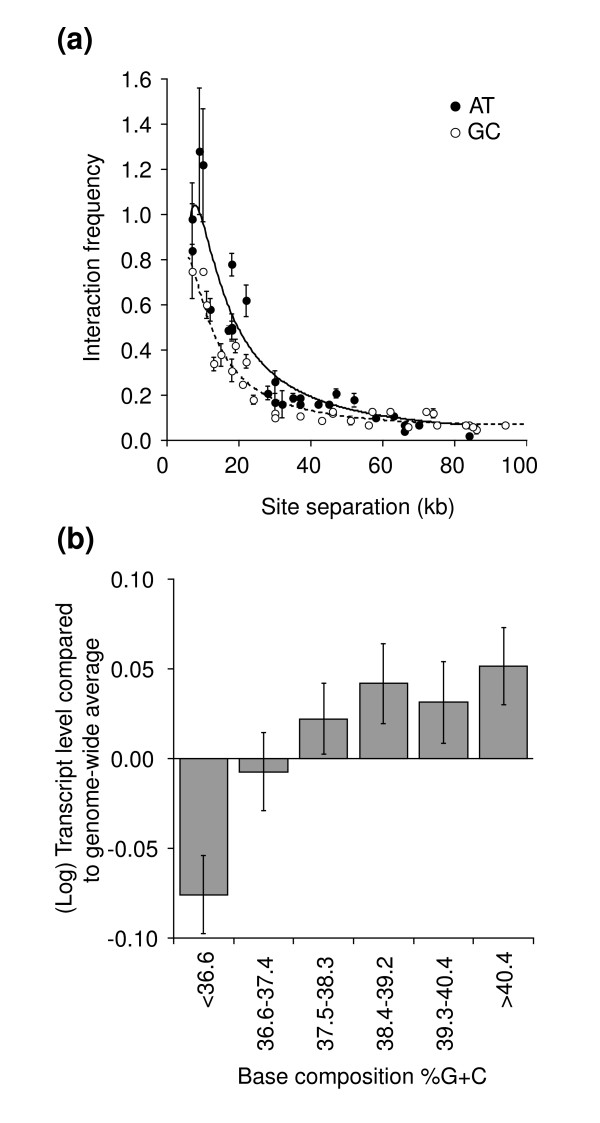
Figure 1.
Isochore domains along chromosome III differ in conformation and activity. (a) Interaction frequencies (the average of three measurements) between loci located within the AT-rich isochore (positions 100-190 kb) of chromosome III (filled circles) or within the GC-rich isochore domain on the right arm of chromosome III (positions 190-280 kb; open circles) were determined in G1-arrested wild-type cells and plotted against genomic distance that separates each pair of loci. Error bars are standard error of the mean (SEM). Dotted and solid lines indicate fits of the data to equation 1 (Table 1). (b) Yeast genes were grouped in six groups dependent on the average base composition of the 4 kb region centered on the start site of the gene is (see Materials and methods). For each group the average steady state transcript level in wild-type cells was determined using data obtained by Bernstein et al. [30]. The genome-wide average transcript level was set at zero. The difference between the most GC-rich group and the most AT-rich group is statistically significant (P < 0.001). Error bars indicate SEM.

