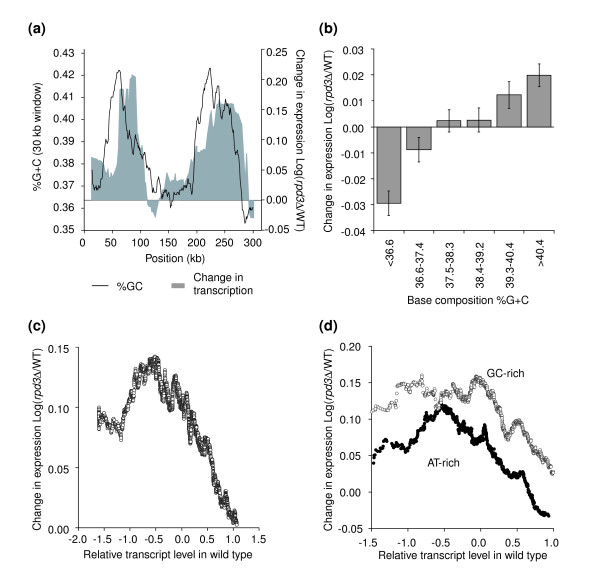
Figure 4.
Rpd3p displays base composition-dependent activity. (a) Patterns of base composition (line) and gene activation (gray area) in rpd3Δ cells along chromosome III as determined by sliding window analysis using a window size of 30 kb and the transcription start sites as midpoints (step size 1 open reading frame). The genome-wide dataset describing the effect of deletion of RPD3 was produced by Fazzio et al. [37]. (b) Genes were grouped in six groups dependent on the average base composition of the 4 kb region centered on the start site of the gene. For each group the average Log of the fold change in transcription in an rpd3Δ mutant compared to wild type was calculated. More GC-rich genes are more activated than more AT-rich genes (P < 10-13 for the difference between the most GC-rich genes and the most AT-rich genes). (c) The moving average (window size 200, step size 1 open reading frame) of the Log of the fold change in transcript level in rpd3Δ is plotted against transcript level in wild type. (d) A similar analysis as in (c) is performed with genes that are in the most GC-rich group and in the most AT-rich group (window size of 100 genes). GC-rich genes are more up-regulated in rpd3Δ cells.

