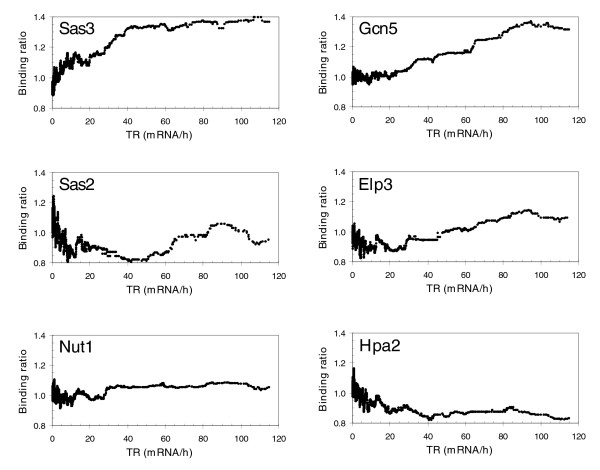
Figure 2.
Correlations between several histone acetyltransferase occupancies and transcription rates. The occupancy was obtained by calculating the moving median of the binding ratio over a sliding window of 100 genes across all genes ordered by transcription rate. The binding ratio was calculated as the ratio of chromatin-immunoprecipitated signals between the epitope-tagged strain and the untagged parent, using the same antibodies. Transcription rate data [36] were also transformed as a moving median of values for each gene over a sliding window of 100 genes across all of them.

