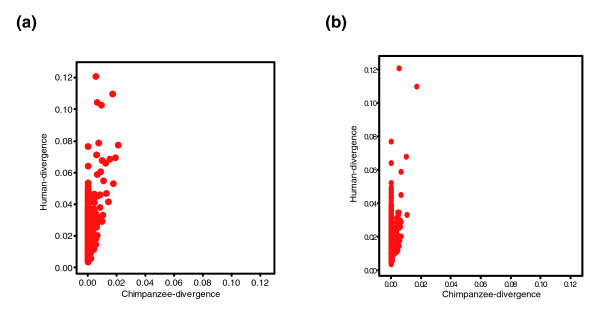
Figure 1.
Substitution rates of 1,356 human-specific ANC sequences. Shown are the relative rates (P distance) of substitutions of (a) the 1,356 accelerated noncoding (ANC) sequences in the human (y-axis) and chimpanzee (x-axis) lineages, and (b) the 1,145 ANC sequences excluding those within potential confounding features (segmental duplications, copy number variants, pseudogenes, and retroposons).

