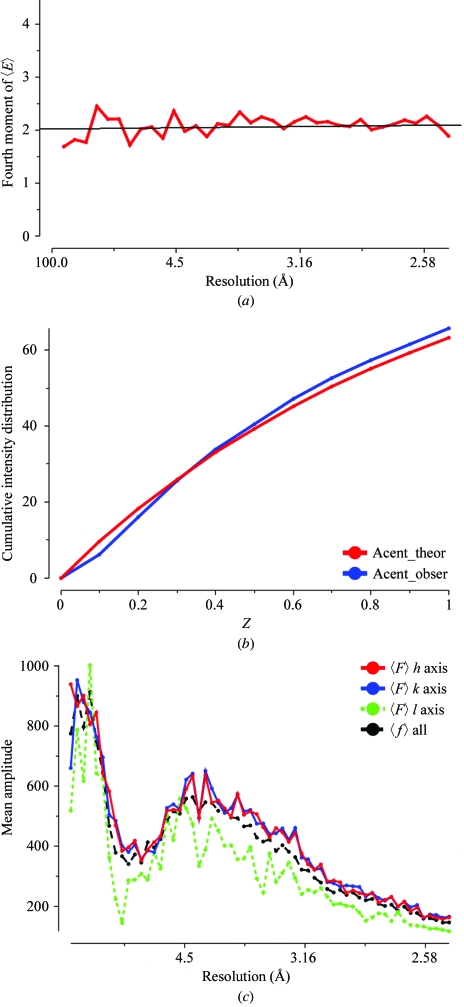
Figure 4.
Quality indicators for the S100 intensity data used to solve the structure. These are all output from the TRUNCATE program. (a) The fourth moment plot of 〈E〉 for acentric data. This is approximately 2.0 across the whole resolution range, showing that the crystal is not seriously twinned. (b) The cumulative intensity distribution. The observed values agree well with the expected theoretical values. (c) An illustration of the anisotropic nature of the intensity distribution. The mean amplitude along the third axis is much weaker than that along the first and second.

