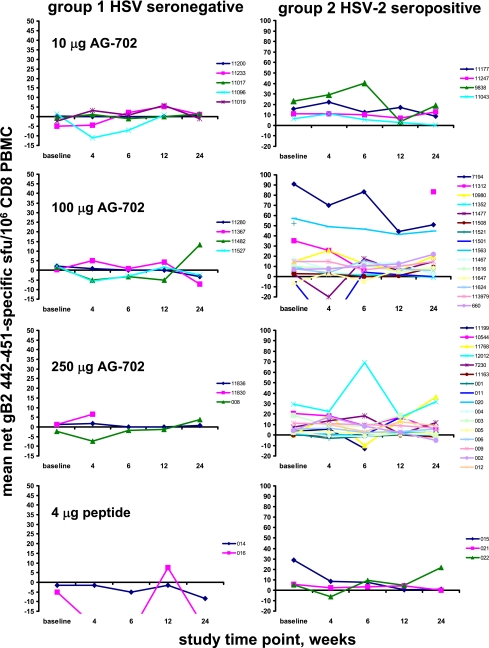
FIG. 1.
CD8 cells in PBMC reactive in IFN-γ ELISPOT with peptide gB2 442-451 prior to and 24 weeks after vaccination with AG-702 or control peptide. Each panel represents one dose level and subject group as indicated. Individual subjects each have a colored line. Data are mean peptide-specific sfu per 106 CD8 PBMC. Note the association of the y-axis scale with subjects’ HSV serostatus.

