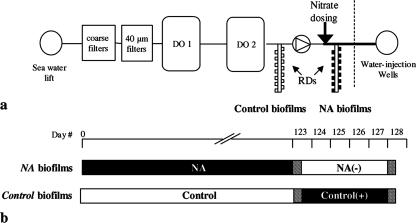
FIG. 1.
(a) Positions of RD in the seawater deoxygenation (DO) system. O2 was removed from the water in a two-stage gas-stripping process after filtration. (b) Schematic diagram of the experimental treatments. Black and white bars indicate exposure to NO3−-rich (1 mM; NA biofilms) and NO3−-free (control biofilms) seawater, respectively. RD were exchanged to opposite conditions on day 123. 15N and 35S tracer incubations were done on days 123 and 128 (hatched bars).

