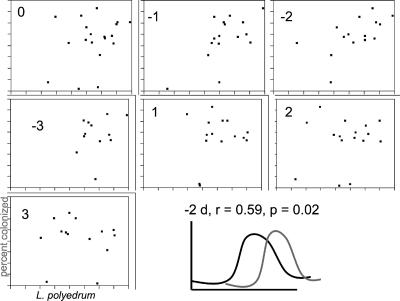
FIG. 5.
Cross-correlation analyses between log-transformed L. polyedrum abundances and RCA cluster colonization frequency during the summer 2005 bloom. The number inside each chart refers to the lag (in days). A lag of −2 days was statistically significant and positive. The last panel shows a graphical representation of the relationship between algal numbers (black line) and bacterial colonization frequency (gray line).

