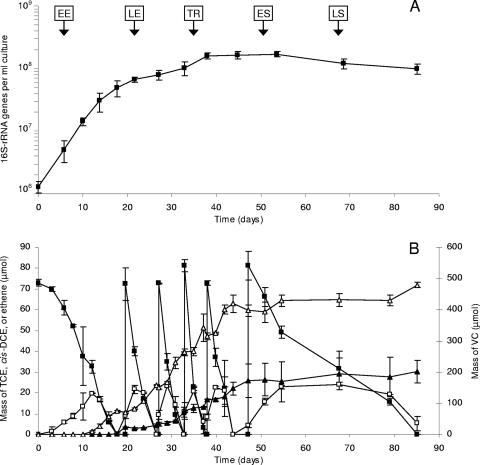
FIG. 1.
Temporal dynamics of Dehalococcoides-specific 16S rRNA genes (A) and chlorinated ethenes (B) in 100-ml batch-pure cultures of strain 195 receiving six consecutive doses of TCE. Vertical arrows in panel A indicate time points when cells were collected for microarray analyses. Symbols: ▪, TCE; □, cis-DCE; ▴, ethene; ▵, VC. All measurements are averages from two biological cultures. Error bars, 1 standard deviation.

