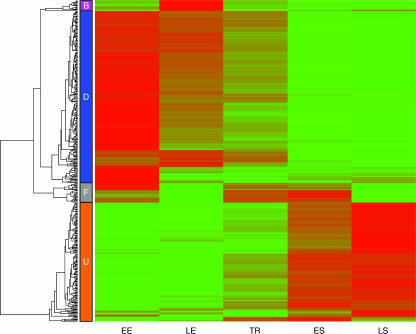
FIG. 2.
Hierarchical clustering and dendrogram of 415 differentially expressed genes (>2-fold; false discovery rate, <0.01). The color gradient from green to red represents increasing microarray hybridization intensity. Four major response groups were detected and are identified by the colored boxes labeled B (biphasic), D (down-regulated), F (fluctuating), and U (up-regulated).

