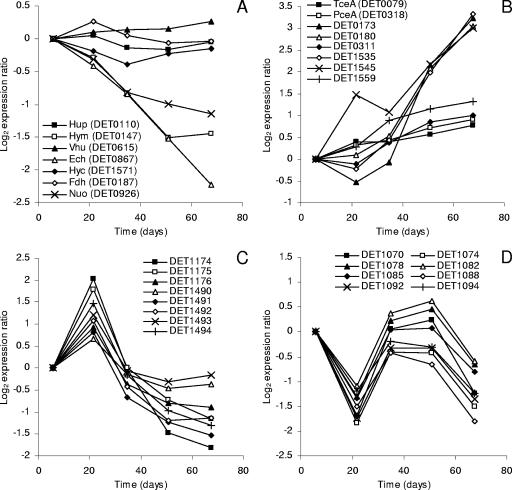
FIG. 3.
Transcription profiles of select genes from each response group. Each expression measurement is the ratio of the hybridization intensity at the specified time to the hybridization intensity observed during the EE phase (day 6). Genes for which results are shown encode oxidoreductases (A), RDases (B), ABC transporters (C), and putative prophage proteins (D).

