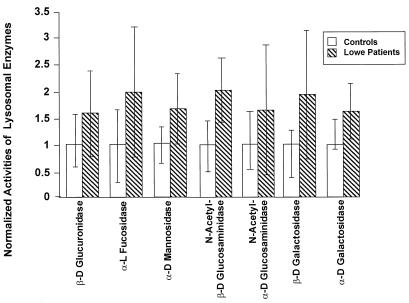
Figure 1.
Lysosomal enzyme activity in control vs. Lowe syndrome patients. The data are normalized so that the mean of the control samples for each enzyme is 1. The differences between control and Lowe syndrome values were evaluated by the Student’s t test. The mean control values and significance of the differences were β-d-glucuronidase, 0.67 nmol/min/ml, P = <0.05; α-l-fucosidase, 3.71 nmol/min/ml, P = <0.01; α-d-mannosidase, 0.07 nmol/min/ml, P = <0.01; N-acetyl-β-d-glucosaminidase, 0.30 nmol/min/ml, P = <0.001; N-acetyl-α-d-glucosaminidase, 0.19 nmol/min/ml, P = <0.1; β-d-galactosidase, 0.0017 nmol/min/ml, P = <0.01; and α-d-galactosidase, 0.015 nmol/min/ml, P = <0.01.

