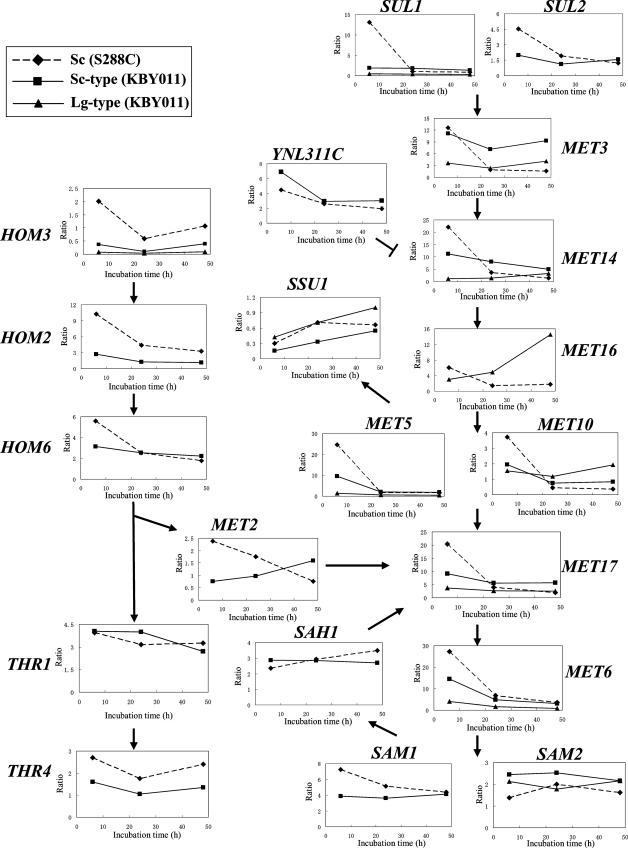
FIG. 3.
Changes in expression levels of genes involved in reductive sulfate assimilation in bottom-fermenting and baker's yeasts. Diamonds, squares, and triangles indicate baker's yeast, bottom-fermenting yeast S. cerevisiae (Sc)-type, and bottom-fermenting yeast Lg-type genes, respectively (experiment 1). The y axis is the expression ratio relative to the zero time point. These microarray data are means of analyses taken from two independent fermentation experiments with very similar results (experiment 1).

