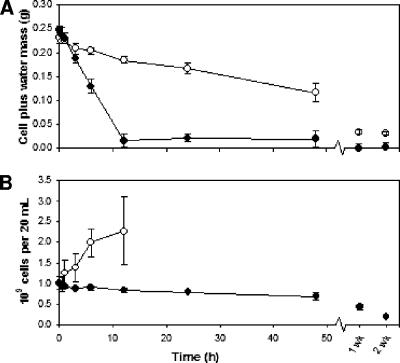
FIG. 1.
(A) Loss of water from desiccated (•) or control (○) cells over time. (B) CFU counts of desiccated (•) or control (○) cells over time. The control experiment CFU counts from 24 h and on were confounded by cells adhering to the membrane. Error bars represent standard deviations of the results for three independent cultures.

