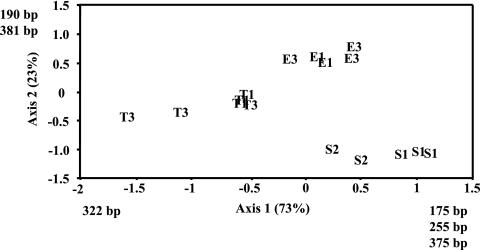
FIG. 4.
Patterns of variation in sedimentary microbial community composition in the nine streams by molecular analysis. Shown is a scatter plot of sample scores from nonmetric multidimensional scaling analysis, with each abbreviation representing an individual sample. The percent variation explained by each axis is represented in parentheses. Abbreviations are as described in the legend to Fig. 1. Identified fragment lengths had Pearson's correlation coefficients of >0.5 or <−0.5 and exerted strong influence on the pattern of variation among samples along the respective component axes. Samples not plotted were not sampled or had been sampled but lost in transport or processing.

