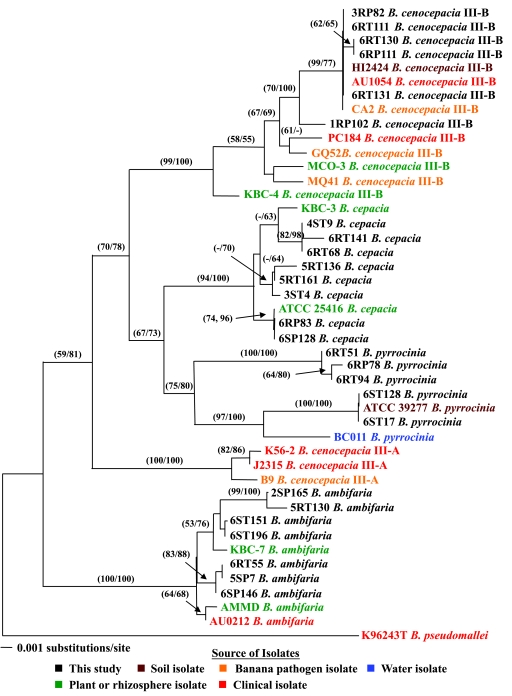
FIG. 3.
Phylogenetic analysis of the recA data set from 45 B. cepacia complex strains with B. pseudomallei K96243T as the outgroup (descriptions of isolates and reference strains are in Table 4). A color key is used to designate the source of isolates used in this analysis. The naming convention for the isolates from this study (e.g., 3RP82) is defined in a footnote to Table 4. The tree shown was obtained by NJ using Kimura two-parameter distances. The numbers in parentheses (MP/NJ) on the branches show the MP and NJ bootstrap values (>50).

