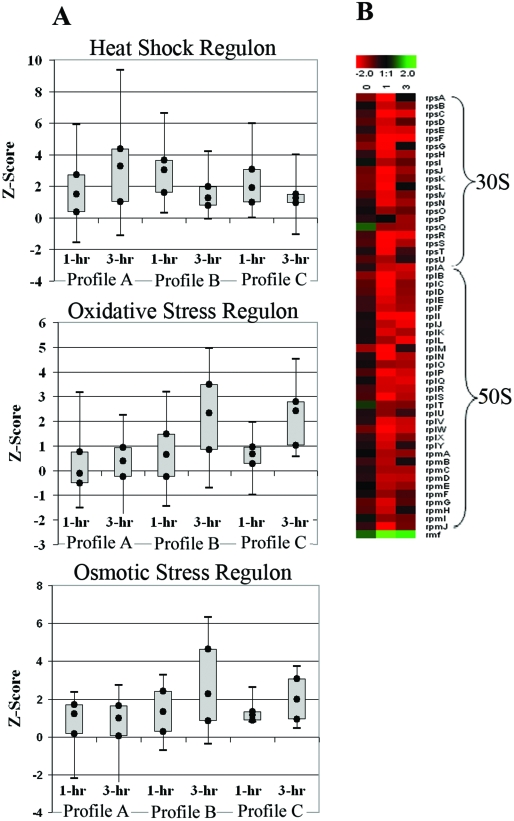
FIG. 5.
(A) Box plots of transcript expression Z scores for the genes in the σ32 heat shock regulon, oxidative stress-regulated genes (OxyR and SoxS oxidative stress regulons), and osmotically induced operons at 1 hour and 3 hours postinduction. The box plots include the Z scores for all genes detected in the respective functional category based upon EcoCyc (40) annotation and gene ontology classification. The local Z score generated from the SNOMAD analysis represents a change value weighted to account for the confidence in the data, and any gene with a Z score with an absolute value of >1.96 was considered differentially expressed (9). The box plots show the values of the greatest down-regulation, lower quartile (Q1), median, upper quartile (Q3), and largest up-regulation observed for each profile for the regulon or gene group indicated. There were three expression profiles generated in this experiment, as follows: profile A, the 1- and 3-hour-postinduction transcript profile for the inactive-pathway control [E. coli DP10 containing pMevT(C159A) and pBAD18] relative to a preinduction profile; profile B, the mevalonate-producing strain (E. coli DP10 containing pBAD33MevT and pBAD18) 1- and 3-hour-postinduction transcript profile relative to a preinduction profile; and profile C, the mevalonate-producing strain's 1- and 3-hour-postinduction transcript profile relative to the inactive-pathway strain's 1- and 3-hour-postinduction transcript profile. A strong activation of the oxidative and osmotic stress regulons was observed in the active-pathway strain but not in the inactive-pathway control strain. The heat shock regulon was activated early in the active-pathway strain, but overall expression of the regulon was lowered at the 3-hour time point. The heat shock regulon remained highly activated in the inactive-pathway control strain. (B) Time course of expression of genes encoding the 30S and 50S ribosomal proteins as well as the ribosome modulation factor (rmf) observed in the cross-strain microarray analysis (mevalonate-producing strain versus the inactive-pathway control strain). The log2(expression ratio) is defined such that positive values (green) represent up-regulation and negative values (red) represent down-regulation in the mevalonate-producing strain compared to the inactive-pathway control. There was a significant down-regulation of ribosomal protein genes in E. coli DP10 harboring pBAD33MevT (active-pathway strain) compared to their expression in E. coli DP10 harboring pMevT(C159A) (the inactive-pathway control strain).

