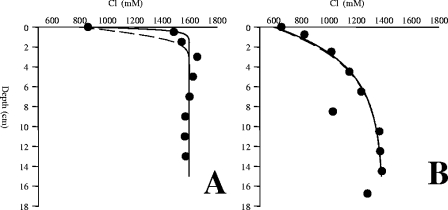
FIG. 4.
Cl− profiles from fluid flow models. (A) Measured Cl− profile from underneath the white mats (circles), modeled Cl− profile at a constant flow of 15 m·a−1 (straight line), and modeled Cl− profile after 10 h with a fluid flow velocity of zero (dashed line). (B) Measured Cl− profile from underneath the orange mats (circles), modeled Cl− profile at a constant flow of 0.6 m·a−1 (straight line), and modeled Cl− profile after 10 h with a fluid flow velocity of zero (dashed line).

