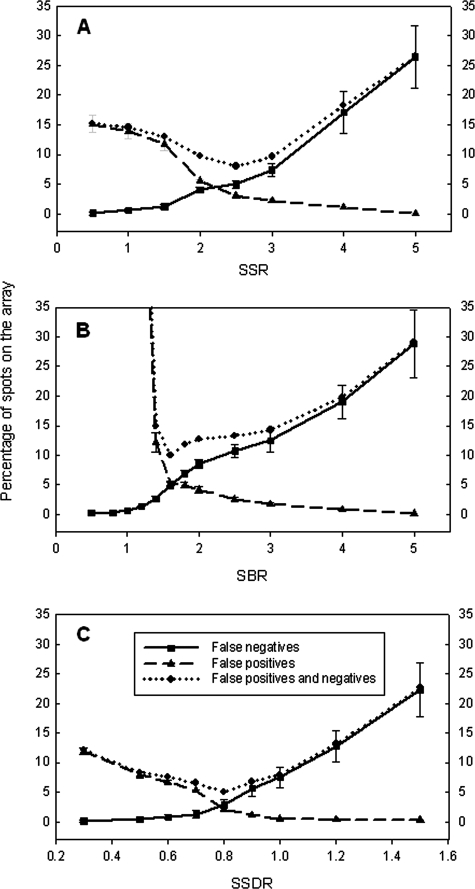
FIG. 2.
Determination of thresholds of the SSR (A), SBR (B), and SSDR (C) at low stringency by minimizing the percentages of FP and FN spots. Ten picograms of each synthesized oligonucleotide was used to hybridize with the array, and five replicate slides were used. The SSR, SBR, and SSDR were determined to be 2.5, 1.6, and 0.80, respectively. The error bars represent standard deviations.

