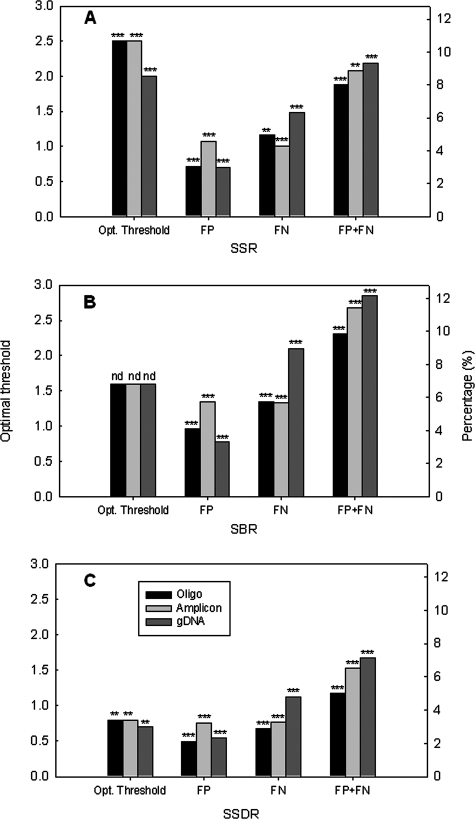
FIG. 4.
Effects of target types on the thresholds and the percentages of FPs, FNs, and both (FP+FN) for the SSR (A), SBR (B), and SSDR (C). The left y axes present the optimal thresholds, and the right y axes present the percentages of FP, FN, or FP plus FN under the optimal threshold. The targets used were synthesized oligonucleotides (10 pg each), PCR amplicons (100 pg each), and S. oneidensis MR1 gDNA (500 ng). The more significant P value is shown on the top of each column, with the following notations: nd, no difference; one asterisk, P < 0.10; two asterisks, P < 0.05; and three asterisks, P < 0.01 (the Student t test) when one type of target was compared with two others.

