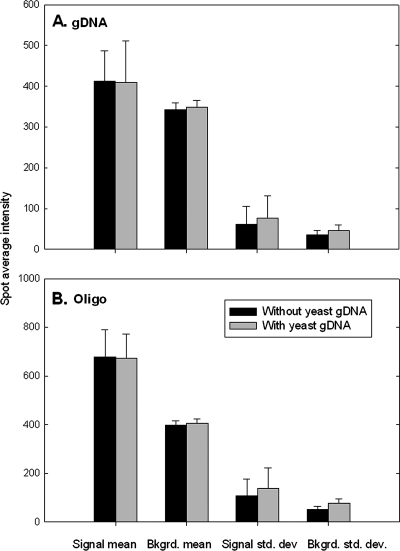
FIG. 6.
Comparison of changes in signal mean, background (Bkgrd.) mean, signal standard deviation (std. dev.), and background standard deviation for each spot on the array when the yeast gDNA was added to the S. oneidensis gDNA (A) or the synthesized oligonucleotide (Oligo) targets (B). The error bars represent standard deviations.

