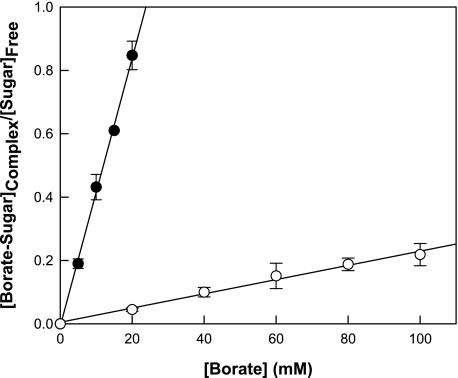
FIG. 5.
KAs of fructose (○) and psicose (•) with various molar ratios of borate to sugar. The KA of each sugar was determined from the slope for the complex concentration/free-sugar concentration ratio plotted against the free-borate concentration. As borate was not visualized by TLC, the concentration of the sugar-borate complex was calculated from the initial sugar concentration and the area of the sugar-borate complex relative to the total area. Data presented are the means of results from 20 experiments.

