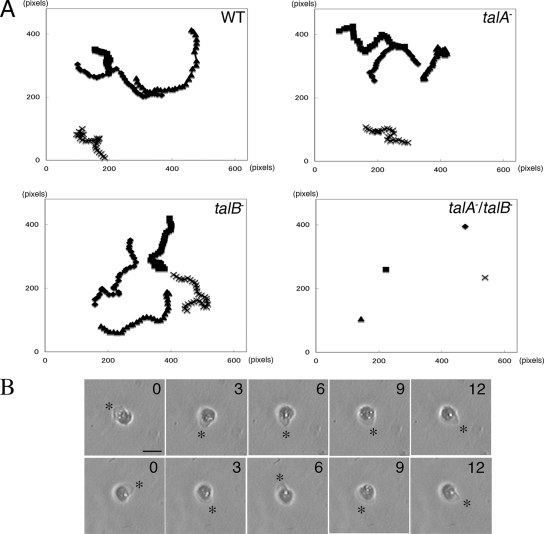
FIG. 8.
Random movements in wild-type (WT), talA−, talB−, and talA− talB− cells starved for 4 h between a glass surface and an overlaid agar sheet. (A) Four representative traces of the random movements of each strain. Cell images were recorded every 3 min for 90 min. 1 pixel corresponds to 1.1 μm. (B) Panels show sequential recordings of two representative talA− talB− cells over a period of 12 min. The cells extended lamellipodia actively (asterisks). Time (in minutes) is indicated at the upper right of each panel. The scale bar represents 20 μm.

